Track vehicle utilization against estimated vehicle life to optimize use in accordance with your replacement policy.
Managing vehicle utilization is a balancing act. When you have limited resources to replace vehicles, ensuring you get the most out of each is imperative. With the latest improvements to the Utilization Summary Report in Fleetio, you can visualize forecasted replacement demand based on actual usage and make key decisions about how to manage your ageing vehicles. Below are some examples of the decision-making power of this report.
Make Changes to Stabilize Vehicle Replacement Demand
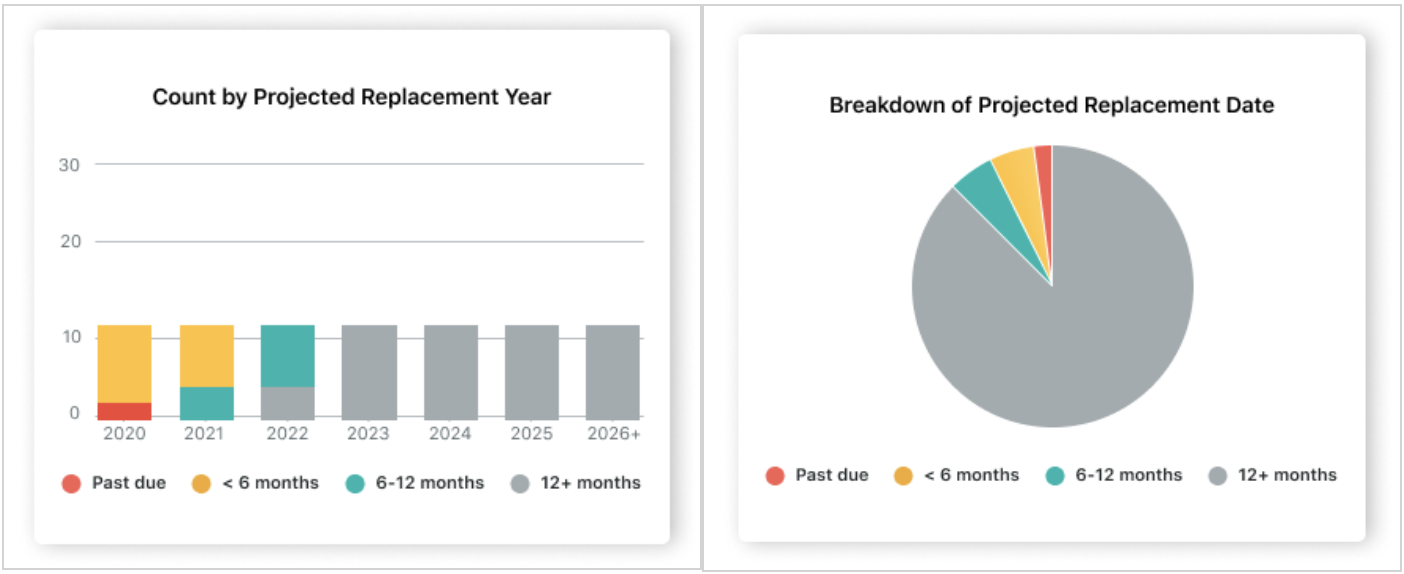
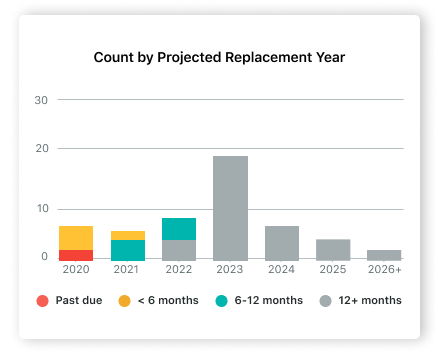
Forecasting replacement demand is imperative for accurate fleet financial forecasting and securing the necessary capital to acquire new vehicles when the time is right. In an established business, a healthy replacement forecast looks relatively even where you have a similar number of vehicles due for replacement each year, like this:
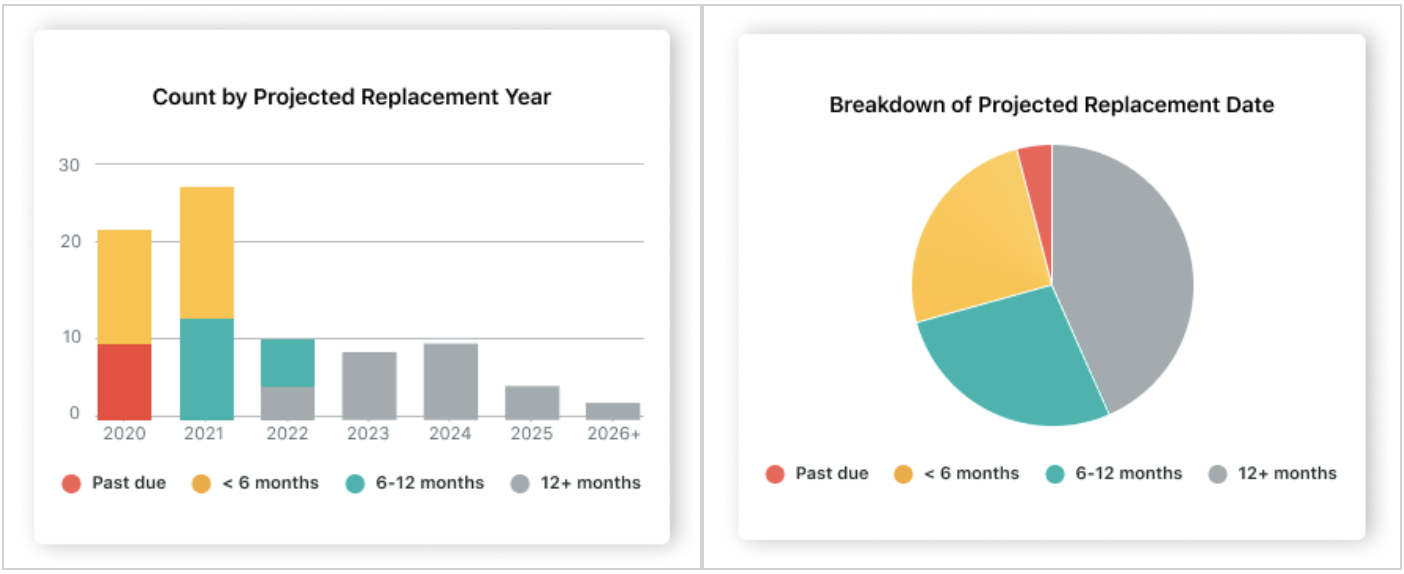
However, if you see spikes in the replacement forecast, you may need to make some adjustments to vehicle utilization to balance this out. Or, if all of your vehicles are being over utilized due to business growth, you know you need to increase your acquisition budget in the future to accommodate fleet demand. Here's an example of uneven demand in the near-term:
Below is an example of uneven demand where demand increases further in the future. In this case, you have more time to prepare for an increase in capital expenditure and spread out replacement activities to minimize impact for upcoming years.
These are just some of the ways you can use replacement forecasting to make key decisions about vehicle replacement and stay in control. Next, let's look at how to make utilization decisions.
Adjusting Utilization for Better Balance Across Vehicles
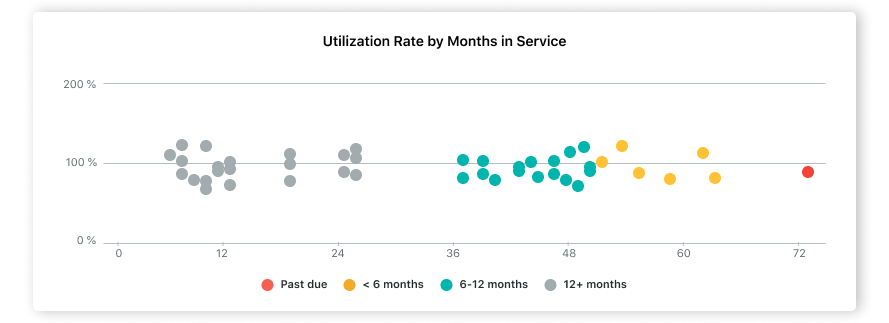
Looking at vehicle utilization rate, you can easily identify vehicles that are being over or underutilized. As a baseline, here's an example of a fairly balanced fleet:
Each Vehicle in this scenario remains close to the 100% utilization line. There is some minor variability, which is normal. As the fleet manager, you must decide how much variability is acceptable for your fleet. Setting an acceptable range of 90-110% variance might seem harmless, but being consistently over by 10% can lead to larger variance and can potentially have cascading effects on your replacement plans.
Now consider the following graph:
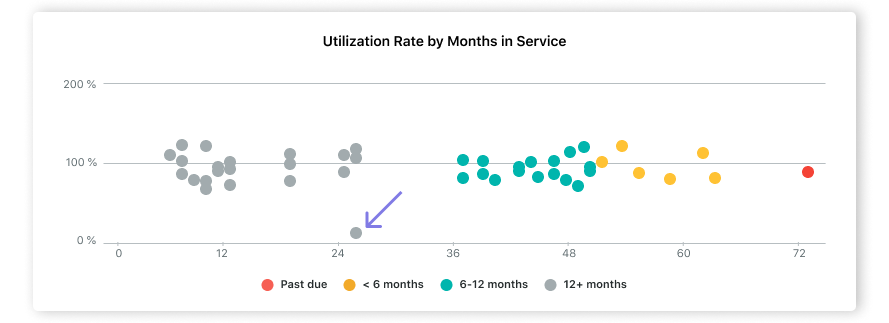
In this scenario, most vehicles are being used as expected, with one notable exception. This may be a sign that you can replace the under-utilized Vehicle and shift its usage to other Vehicles.
Finally, if you have a graph that looks like this:
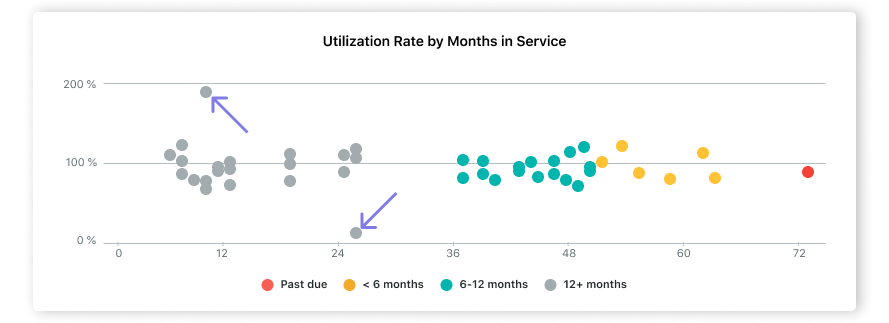
Consider switching vehicle assignments or routes. In this case, there is both a heavily under-utilized vehicle, and a vehicle being over-utilized. If you see a similar pattern, you might switch Vehicle Assignments or routes in order to balance their utilization.
We hope these improvements to utilization reporting make it easier to set budgets based on replacement demand and ensure the optimal utilization of your vehicles. We'd love to hear what you think! Get in touch at feedback@fleetio.com.